Microcomputer-Based Laboratories in the Science Classroom
Introduction
One of the most powerful uses of the microcomputer in science teaching is to have students use it as a laboratory tool to collect and analyze data. Science educators refer to this use of a microcomputer as microcomputer-based laboratory (MBL). Using MBL, students utilize a microcomputer and accompanying probes to collect, record, and graph data to support the construction of their science concepts. The term probeware has been applied to describe the probes, interfacing boxes and software needed to use the microcomputer as a laboratory tool. Examples of probes used to collect laboratory data include temperature, motion, force, pH, sound, light and pressure.
Microcomputers used as laboratory tools may offer a fundamentally new way of aiding students' construction of science concepts (Linn, Songer, Lewis & Sterm, 1991; Mokros and Tinker, 1987). They also allow students to experience what it is like to do science (Tinker & Papert, 1989). MBL provides opportunities for asking and refining questions, making predictions, designing plans and /or experiments, collecting and analyzing data, debating ideas, communicating ideas and findings with others, drawing conclusions, and asking new questions. In addition, the use of the microcomputer may strengthen students' graphing and problem solving skills (Linn, Layman, Nachmias 1986). For example, a temperature probe helps students construct an understanding about temperature and heat energy by allowing them to monitor the temperature of physical systems.
The capability of MBL to immediately transform data from each experiment into a graph, the most powerful form of information presentation, is something that has not been possible in the past. Students simultaneously watch a graph being plotted as they are conducting the experiment. Much of the rich information obtained as a graph and produced during an activity, must surely remain associated with the graph.
Because the microcomputer does the work of graphing, microcomputer-based laboratories allow students to focus on analyzing graphs and science concepts involved in the activity. Quick turn around time also allows students to perform more experiments in the amount of time typically allotted for lab; moreover, the flexibility of the probeware gives students more of an opportunity to plan and design their own experiments. For instance, quick turn around time allow students within one class period to test how containers of the same volume and shape but made from different materials influence the rate of cooling.
In addition, because students must choose some of the conditions for the experiment as well as the scales for both axes of the graph, the power of this tool to help students understand information on a graph is further increased. Most MBL packages allow students to store the data and to make printouts of the data and the graphs. The printouts can be used in class discussions, and/or required for the inclusion of laboratory reports.
Real-time graphing may be one of the key elements in helping students construct science concepts and graphing skills because it provides opportunities for students to connect the production of the graph with the physical manipulation of the materials. Brasell's (1987) work indicates that even small delays in graph production of 20-30 minutes hinders students' concept development. Real-time graphing also provides opportunity for students to modify the initial or experimental conditions and immediately see the effect of their modification on the resulting graph.
Microcomputer-based laboratory tools are quick and easy to use and make repetitions of an experiment, with slight variations each time, easy to do. This is especially important when students say "What if we did this instead of that." The ease in which students use the MBL and the real time graphing feature allows students to immediately act on their own questions and see results while the idea is fresh in their minds. MBL activities encourage students to create and answer their own "What if" questions, rather than just answer questions supplied with the laboratory manual. According to Mokros and Tinker (1987), students using probeware "have unprecedented power to explore, measure, and learn from the environment." An important outcome of using MBL may be that students spend less time gathering, and more time interpreting and evaluating the data, allowing for more activities central to critical thinking, problem solving, and self-monitoring skills. Hence, students are more willing to replicate, to evaluate, and improve the experiment.
Table 1 presents a summary of the characteristics of using MBL in the science classroom.
 Because of the interactive nature of microcomputer-based laboratories and because microcomputer-based laboratories link the concrete experience of data gathering with a symbolic representation of real-time, many science educators support the use of MBL to enhance the learning of science concepts, science process skills, graphing skills, and problem solving abilities for a broad range of science students. At this time a growing body of research evidence exists to support these claims (Linn, et al., 1991; Linn & Songer, 1988; Nakhleh & Krajcik, 1991; Mokros & Tinker, 1987).
The teacher plays a pivotal role in creating an atmosphere that allows students to investigate. Our work (Krajcik & Layman, 1989; Krajcik, Layman, Starr & Magnusson, 1991) indicates that the overall effectiveness of MBL will depend upon the teachers' understanding of how to use the new technology, their personal knowledge of the concepts involved, and their knowledge of how to help students link their experiences with the concepts. For instance, microcomputer-based laboratories provide opportunities for students to collect real-time data, ask "what if" questions and use electronic sensors to test their predictions and view the results of these experiments in various forms like graphs or charts. Research in classrooms indicates that carrying out this type of instruction is difficult. Science teachers are more comfortable in lecture and discussion situations, and tend to stress right answers over hypothesis generation, prediction, data collection, and analysis (Tobin, Kahle, & Fraser, 1990). The research also suggests that the instructional component is central to helping students construct science concepts. The work of Linn and her colleagues (Linn, et al., 1991; Linn & Songer, 1988) and Thorton and Sokoloff (1990) indicates that engaging in making predictions prior to performing an MBL activity appears to enhance students' concept learning. Moreover, students need opportunities to compare their results to their prediction after the experiment is completed and to generate and test new ideas in light of their conclusions. In the University of Maryland Middle School Probeware Project (Layman & Krajcik, 1988), we have encouraged middle school science teachers to allow students to make predictions, compare their predictions with the results they have obtained and ask new "what if" questions based on the results of their analyses.
MBL is only a tool, and unless researchers have well-integrated understandings of the science concepts and the processes associated with the experiments, students will not benefit from the use of these tools. By providing carefully structured learning experiences, teachers help students generate new ideas, restructure old ideas and integrate related ideas.
Examples of Microcomputer-Based Laboratories
Students using temperature probes, to collect and graph temperature data are excellent example of a microcomputer-based laboratory. A temperature probe attaches to a microcomputer through an interfacing box and then placed in a chamber of hot water will produce a graph of temperature versus time and record temperature history as the water cools.
Figure 1 shows a temperature time graph produced by using a temperature probe.
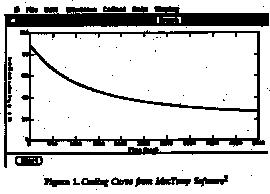 Examples of laboratory activities that take advantage of this capability include: a study of the cooling and heating of liquids , the influences of a container (insulation) on heating and cooling rates; and the influence of the volume of a liquid on its cooling rate. Students can also use an additional feature of MBL, the influence of transferring heat energy to a system while monitoring the effect of the systems' temperature, Using a heat pulser, students control the amount of heat energy placed into liquids, such as water or glycerine, by changing the number and duration of the pulses (each pulse with a specified duration places a specific quantity of energy into a system). By placing the same number of pulses (amount of heat) into different quantities of water, learners construct an understanding that temperature and heat energy are two different concepts.
Other microcomputer-based tools utilize motion detectors to collect information about objects in motion, photocells to collect data about various phenomena that influence light, and sound probes to collect information on frequency and amplitude. These various microcomputer-based laboratory tools allow students to explore concepts in new and exciting ways. One very exciting MBL package for the biological sciences allows students to attach a miniature clothespin-like clip to the earlobe or finger that uses a photocell that senses the pulsations of the blood as it surges through the tissues. This procedure allows students to collect and graph heart beats per minute. Using parameters chosen by the student (length of experiment, collection interval times), data is collected and simultaneously graphed.
A motion detector allows students to produce real-time graphs of distance, velocity and accelerations for objects moving towards or away from the motion detector.
Figure 2 shows a distance versus time graph and a velocity graph that were produced in real-time as a student moved toward and away from the motion detector.
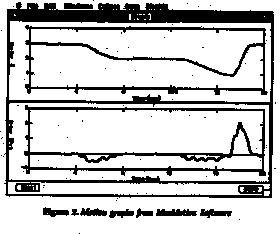 A motion detector allows students to explore concepts related to motion in fundamentally different ways than were possible in the past.
Sound probes allow students to explore sound by comparing, on a graph generated by the computer, the loudness and frequency of various sounds. A speaker interfaced with a microphone generates specific sounds, and the computer converts the electrical signals from the sounds into visual representations that are projected on the monitor. As the students hear the sounds, they see a graph of the frequency and amplitude of the sound waves they are hearing. One example, always of great interest to students, is a comparison of the graphs of sounds from two different instruments playing the same note. Students tell which note comes from which instrument just by listening, but the question arises, "How else are they different?" Comparing the graphs of each sound shows that the two sounds have the same fundamental frequency but different overtones. This possibility of directly observing a graphical representation of a physical event as if it is happening may give students a firmer grasp of concepts.
Conclusion
Microcomputer-based laboratory packages present many new and exciting uses of the microcomputer in science teaching that help students actively construct their science understanding from data they collect in laboratory settings. MBL tools promote and encourage students to ask and answer their own "What if questions" and, in so doing, experience what it is like to do science. However, the research indicates that MBL tools by themselves will not develop an environment that will allow students to explore concepts. The teacher and the instructional setting play a critical role in shaping an environment that will allow for an active, constructivist microcomputer-based laboratory setting. Microcomputer-based laboratories are only tools that must be incorporated into science teaching by a skillful and knowledgeable teacher.
by Joseph S. Krajcik, University of Michigan, Ann Arbor, MI and John W. Layman, Science Teaching Center
University of Maryland, College Park, MD
References
Brasell, H. (1987). The effect of real-time laboratory graphing on learning graphic representation of distance and velocity. Journal of Research in Science Teaching, 24(2), 385-395.
Krajcik, J. S., & LAyman, J. W. (1989, March). Middle school teachers' conceptions of heat and temperature: Personal and teaching knowledge . Paper presented at the 62nd annual meeting of the National Association for Research in Science Teaching.
Krajcik, J. S., Layman, J. W., Starr, M. L., & Magnusson, S. (1991). The development middle school teachers' content knowledge and pedagogical content knowledge of heat energy and temperature. Paper presented at the AERA annual meetings.
Nakhleh, M. B., & Krajcik, J. S. (1991, April). The Effect of level of information as presented by different technologies on students' understanding of acid, base, and pH concepts . Paper presented at the 64th Annual Meeting of the National Association for Research in Science Teaching, WI.
Layman, J. W., & Krajcik, J. S. (1988). University of Maryland middle school probeware project . National Science Foundation, TPE-8751744, University of Maryland, College Park, MD.
Linn, M. C., Layman, J. W., & Nachmias, R. (1987). Cognitive consequences of microcomputer-based laboratories: Graphing skills development. Contemporary Education Psychology, 12(3) 244-253.
Linn, M. C. & Songer, N.B. (1988, April). Cognitive research and instruction: Incorporating technology into science curriculum. Paper presented at the American Educational Research Association Meeting, New Orleans, LA.
Linn, M., N. B., Lewis, E. L., & Stern, J. (1991). Using technology to teach thermodynamics: Achieving integrated understanding. In D. L. Ferguson (Ed.), Advanced technologies in the teaching of mathematics and science , Berlin. Springer-Verlag.
Mokros, J. R. (1985). Can microcomputer-based labs improve children's graphing skills? Paper presented at the MBL symposium, TERC, Medford, MA.
Mokros, J. R., & Tinker, R. F. (1987). The Impact of microcomputer-based labs on children's ability to interpret graphs. Journal of Research in Science Teaching, 24(4), 369-383.
Tinker, R. F., & Papert, S. (1989). Tools for science education. Association for the Education of TEachers in Science 1989 Yearbook, J. Ellis (Ed.) SMERIC: Columbus, OH.
Thorton, R. K., & Sokoloff, D. R. (1990). Learning motion concepts using real- time microcomputer-based laboratory tools. American Journal of Physics, 58(9), 858- 867.
Tobin, K., Kahle, J. B., & Fraser, B. J. (Editors). (1990). Windows into science classrooms: Problems Associated with higher-level cognitive learning. London: Falmer Press.